SYNTHETIC FIBERS, POLYMERS
GASES and LIQUIDS
| SPONSORS | SPONSORS | SPONSORS | SPONSORS |
| SPONSORS | SPONSORS | SPONSORS | SPONSORS |
Suppliers, Vendors: Post your supplies here. Simply email us at info@syntheticforest.
Post your Requisitions Here.
Are you a Company that is selling a Machine? Get a spot here!
We are working daily to improve your experience in this Piece of Forest.
World Regulatory Bar: To improve the Engineering World, The Synthetic Forest seeks to explore and compare differences in World Engineering Regulations.
PROJECT MANAGEMENT
|
Value ManagementPredictive Study Project Planning Risk Management Design Management Information Management Supply Chain Management Procurement Commissioning |
Engineering Finances
|
Benefit Analysis
Sources of Finance Equity, Loans, Working Capital Microsoft Project |
Tank Inspections (Pharmaceutical)Storage Tanks BioReactors Portable Tanks |
49CFR180.407 Electropolishing and Surface Priming Impeller Selection, Mixing Profiles, Heat Profiles Turnover Packages Inspections, Materials Selection, Pipeline Installations, Leak Tests, Seals and Gaskets Cleaning Skits, Soap Selection, Cleaning Strategies, Cleaning Validation |
Laboratory Inspections
|
Quality Laboratory Inspections Non Conformance Investigations LIR's Product Performance Product Release Material Inspections CAPAs and EVs |
Lyophilization |
21CFR is FDA Pressure Stage vs Temperature Stage High Vacuum, ISO5 to ISO8 Facility Particle Counters Viable and Non Viable Point Differential Finite Element Analysis CFD |
Cell Culture (Biotechnology)
|
21CFR610 General Biological Products Cell Growth and Scale Up: From Clones to Grafts. Cell Culturing and Lab Analysis: PCR, North to West Blots. Electrophoresis, Gene Chips, Sequencing Analysis. Biotechnological Testing Equipment Comissioning. Centrifuges, Filters, Pumps, Dispensing Systems. Test Selection and Design of Experiments. |
Marine Vessel Inspections
|
46CFR Oil Carriers, Food Carriers, Vessel Entry Permits. Enclosed Vessels Cryogenic Vessels
|
Water Treatment Inspections |
40 CFR414 Effluent Guidelines OCPSF Organic, Chemical, Plastics, Synthetic Fibers Waste Water Pretreatment Release Permitting |
DOCUMENTATION CONTROL
|
Document Qualification User Requirements GMP/ISO Specifications URS, IQ, OQ, PQ
|
HVAC System Validation
|
Installing Compressed Air Lines Installing Chillers Installing Refrigeration Units Installing Boilers
|
Flammable Hot Work |
Working with Flammables Fire Safety and Regulations NFPA Storage and Safety Explosion Prevention Fire Management |
Computer System Validation CSV
|
21CFR11 Input/Outputs LAN Connection Data Storage Audit Trails Electronic Signature Data logs and Forms Network Infrastructure Communication Protocols Integrity and Security |
Energy Savings
|
Illumination LED Systems Control Panels Power Consuption Estimation
|
Packaging
|
Non Conformance Serialization Package Tracking Safety Material Storage Stability Packaging Packaging Materials Laser Printing |
Quality |
Food and Drug Quality Risk Management Management Systems Quality Engineering Quality Assurance Traceability Serialization Workflow Optimization Workflow Streamlining |
Synthetic |
Catalysis and Reconstitution Fischer Tropsch Reactors Inductive Heating into Syn Gas Sugars and Derivatives Exothermal Control |
Drug Delivery Systems
|
Controlled Release Systems Compounding Strategies Solid Blending Solutions, Emulsions, Suspensions. Drug Delivery Technologies |
Synthetic Materials |
Compounds Semiconductors / Superconductors Organic / Inorganic Polymers |
SYNTHETIC FIBERS, POLYMERS
GASES and LIQUIDS
ALL HERE:
Call 1.787.685.9808
for material queries.
We can match your project needs with our consultats. Please call us to let us know what you need. From Training Services to Installations, Comissioning, Retrofit Modifications. We are involved in all areas of Engineering: Electrical, Chemical, Mechanical and Civil Engineering.
We also provide Legal Services like Experts for litigation, Permitting for Local and State requirements, and Attorneys.
Our goal is to service your needs Here!
-Under Construction- If you are a State or Local Government Representative and would like to post information on this site please email us at info@syntheticforest.net
| World Law Bodies | |
|---|---|
| Country | Links |
| Switzerland | http://www.admin.ch/ch/e/rs/rs.html |
| United States of America | http://www.usa.gov/Topics/Reference-Shelf/Laws.shtml |
| China | http://guides.library.harvard.edu/chineselegalresearch |
| European Union | http://eur-lex.europa.eu/en/index.htm |
| Brazil |
|
| India | http://www.indlaw.com/ |
| Russia | http://www.russianlawonline.com/encyclopaedia |
| Japan | http://www.japaneselawtranslation.go.jp/?re=02 |
| South Korea | http://www.moleg.go.kr/english/korLawEng |
| Australia | http://australia.gov.au/topics/law-and-justice |
| South Africa | http://www.lssa.org.za/ |
ENGINEERING TRENDS:
INSTALLATIONS
|
||||||||||||||||||||||||||||||||||||||||||||||
Heat Exchangers, Chillers, Air Handling Units, Compressors, Pump, Ducts, Piping, Refrigerant
Operation/Maintenance/Servicing/Warranties
HVAC GMPs
API HVAC
Oral Solids Sterile Products & Medical Devices
HVAC requirements for GMP
Design to Qualify, EconomicsQualification and Risk
IQ - OQ - PQ
Wrap UpAir Filter References
GMP References
Design References
Qualification References
HVAC system concepts
HVAC system-critical parameters
Cleanroom air classifications and explain how they are applied
Role of HVAC in protecting products
Examine typical HVAC system designs utilized for bulk, oral solid dosage, sterile, biopharmaceutical, and packaging and warehousing operations
Understand the basics of process laboratory HVAC
HEPA filter theory, application, monitoring, testing, and repair
Cite HVAC maintenance requirements
ENGINEERING TRENDS: CLEAN ROOM TESTING:
CLEAN ROOM TESTING
| Tests | Description |
| Airflow Volume / Velocity Readings | Assures that both unidirectional and non-unidirectional flow areas are properly balanced and unidirectional zones are maintaining proper air patterns |
| Room Air Exchange rates | States if the area is meeting its design airflow |
| HEPA Filter Integrity Testing | Tests HEPA filters and system for leaks |
| Non-viable Particle Counting | Reports the amount of airborne particulate of a specified size in the clean zone |
| Temperature / Relative Humidity Testing | Examines whether the air HVAC controls are functioning properly and uniformly |
| Pressure Cascade Monitoring | Verifies that room differential pressures are operating according to design |
| Air balancing | Adjusts airflow in the air handling systems to achieve design airflow, room air exchange rates, and pressure cascade |
| Airflow Visualization Testing | Qualitatively verifies airflow direction using a source of visible fog |
| Viable Environmental Monitoring | Samples both the air and surface for microbe enumeration and identification |
| Compressed Gas Testing | Assures that the compressed gas sources meet the requirements of the controlled environment for contamination and microorganisms Lighting, vibration, and sound tests – assures worker comfortAll other special tests from the ISO/IEST guidelines |
| UNDER CONSTRUCTION | UNDER CONSTRUCTION UNDER CONSTRUCTION |
| UNDER CONSTRUCTION | UNDER CONSTRUCTION UNDER CONSTRUCTION |
| UNDER CONSTRUCTION | UNDER CONSTRUCTION UNDER CONSTRUCTION |
| UNDER CONSTRUCTION | UNDER CONSTRUCTION UNDER CONSTRUCTION |
References: [cGMP], Institute of Environmental Sciences Technologies [IEST], and International Organization for Standardization [ISO].
WATER MANAGEMENT
Waste Water Systems
Sprinkler Systems
Steam Systems
UNDER CONSTRUCTION
WATER MANAGEMENT SYSTEMS
Typical Water Management Systems used by manufacturing and power plants include the following processes:
Desalinization
Filtration
Softening
Disinfection
Sanitization
Iron Removal
Precipitation
Reduction of Inorganic and Organic Material
ENGINEERING TRENDS: ENGINEERING BOTTLENECKS
Are you managing an unmaneagable process? What are the bottlenecks? Personnel, Systems, Budget, Seasonal Variations, Publicity, Vendors?
Personnel Bottlenecks: Rotten Apples: One employee...
Project Management (PM) does not deal with "Business as Usual", PM deals with projects or with tasks that have a beginning, middle and end, and evolve over the course of time until the project is handed over to a client.
PMN balance Budget, Time, and Money and Staff in the phases of Planning/Initation, overseeing Execution and Monitoring, Troubleshooting and Closing.
PMN execute in different ways under Information Technology, Biotech, or Construction. Generally PMN deal with Scheduling, Tracking, Budget Control, Risk Management, Strategizing, Quality Management, Workflow Control, involving Resource Allocation, Human Resource Management, Material Resource Management, and Tme Mangement.
Identify Deliverables: Benchmarks
Draft Project Plan:
Draft Project Checklists: Outline all Tasks needed to complete the project and check tasts as they are completed.
Update Stakeholders with Presentations
Value Management
This post is about learning the basic fundaments about calculating value, reducing losses, and understanding the constraints related to projec management. The list will not be exhaustive, however, with your help this list can be refined and sharpened to focus on the more salient or pertinent calculations regarding this matter. Most projects can be manages with simple spreadsheets but Engineering Projects involve short term and long term predictions on the impact of expenditures on the overall budget and these considerations are communicated frequently to investors and stakeholders. The results of these calculations have imminent effects on the final physical structure and often lead to drastic project overhaul or expansions.
Planned value (PV): The approved budget for the work scheduled to be completed by a specified date; also referred to as the budgeted cost of work scheduled (BCWS). The total PV of a task is equal to the task’s budget at completion (BAC)— the total amount budgeted for the task.
Earned value (EV): The approved budget for the work actually completed by the specified date; also referred to as the budgeted cost of work performed (BCWP).
Actual cost (AC): The costs actually incurred for the work completed by the specified date; also referred to as the actual cost of work performed(ACWP).
Schedule variance (SV): The difference between the amounts budgeted for the work you actually did and for the work you planned to do. The SV shows whether and by how much your work is ahead of or behind your approved schedule.Cost variance (CV): The difference between the amount budgeted and the amount actually spent for the work performed. The CV shows whether and by how much you’re under or over your approved budget.
Schedule performance index (SPI): The ratio of the approved budget for the work performed to the approved budget for the work planned. The SPI reflects the relative amount the project is ahead of or behind schedule, sometimes referred to as the project’s schedule efficiency. You can use the SPI to date to project the schedule performance for the remainder of the task.
Cost performance index (CPI): The ratio of the approved budget for work performed to what you actually spent for the work. The CPI reflects the relative value of work done compared to the amount paid for it, sometimes referred to as the project’s cost efficiency. You can use the CPI to date to project the cost performance for the remainder of the task.
Schedule and cost variances and performance indicators are defined mathematically as follows:
Schedule variance (SV) = Earned value (EV) – Planned value (PV)
Cost variance (CV) = Earned value (EV) – Actual cost (AC)
Schedule performance index (SPI) = Earned value (EV) / Planned value (PV)
Cost performance index (CPI) = Earned value (EV) / Actual cost (AC)The final step when assessing task performance to date is to update what you expect your total expenditures will be upon task completion. Specifically, you want to determine the following:
Estimate at completion (EAC): Your estimate today of the total cost of the task
Estimate to complete (ETC): Your estimate of the amount of funds required to complete all work still remaining to be done on the task
PM: ISO3100 RISK MANAGEMENT Risks are about events that, when triggered, cause problems or benefits. Any event that may endanger achieving an objective partly or completely is identified as risk.
Identification: Once risks have been identified, they must then be assessed as to their potential severity of impact (generally a negative impact, such as damage or loss) and to the probability of occurrence.
Assessment: Once risks have assessed, all techniques to manage the risk fall into one or more of these four major categories:
Implementation and Review: Evaluate whether the previously selected security controls are still applicable and effective
Prioritizing the risk management processes too highly could keep an organization from ever completing a project or even getting started.
Risk Analysis Tools:
Fault tree analysis (FTA)
Failure mode and effect analysis (FMEA)
Hazard and operability study (HAZOP)
Risk traceability analysis
Tracking Tables
| Identify (Source Risk) | Analyze | Response | Control (Monitoring | |||||
| ID | Description | Category | Probability | Impact | Added Days | Status of Response | Response Cost | Total Cost |
| x | Chiller Efficiency Drop | Utilities | 0.01 | High | 4 | Chiller Maintenance Pending | $x,xxx.xx USD | $x,xxx.xx USD |
Methodologies and Project Life Cycles 1
Project Management Certifications
Do you really need MS Project?
PROJECT MANAGEMENT TRENDS: STAFFING
Do you really need MS Project?
ENGINEERING TRENDS: QUALITY MANAGEMENT SYSTEMS: Trends in Administrations systems, phylosophical differences between QMS, Hierarchical and Organizational Differences.
Drug Manufacturing Quality Documentation: Managing a Drug Manufacturing Site requires precise control over all steps that impact the Identity, Purity, Efficacy, and Quality of the product. The high level of precision requires that manufacturing tasks are well understood by personnel and these tasks are not limited to steps making the drug product. Control requires ALL areas to provide the highest standards of as required by local and international standardizing and regulatory bodies.
Have you covered all aspects of the working site? Are you missing a an area? Would you imagine working in areas where tasks were not defined? Documentation needs to describe the areas, processes, machines, units as well as steps, calculations and precautions.
There are many more areas that require precise documentation to provide the rigor and control required to produce a high quality chemical product.
In order to produce and control such documents facilities have document management systems that provide easy access to employees. Employees become familiar with the tasks before executing them and with these documents employees are Trained-and-Tested to provide a level of proficiency prior to execution. These documents are "Living Documents", what this means is that once drafted the documents are not destroyed. Instead they go through a lifetime of changes and these changes however minor are docmented and tracked within the document so people reading the document can see the changes to the document through revisions.
Changes do not become effective until 75-85% of all employees have been trained on the changes. So after rigorous control it is expeced that changes howere impactful or minor are taken into account by all employees driving continuous improvement.
PROCESS TRENDS: SERIALIZATION, GLOBAL HARMONIZATION: Packaging, Stacking, Monitoring, Storage, Shipment and Control.
New Medical Products
What considerations are needed to Manufacture a New Product
New Drug Application
New Dietary Supplements
New Biomedical Devices
New Drug Application
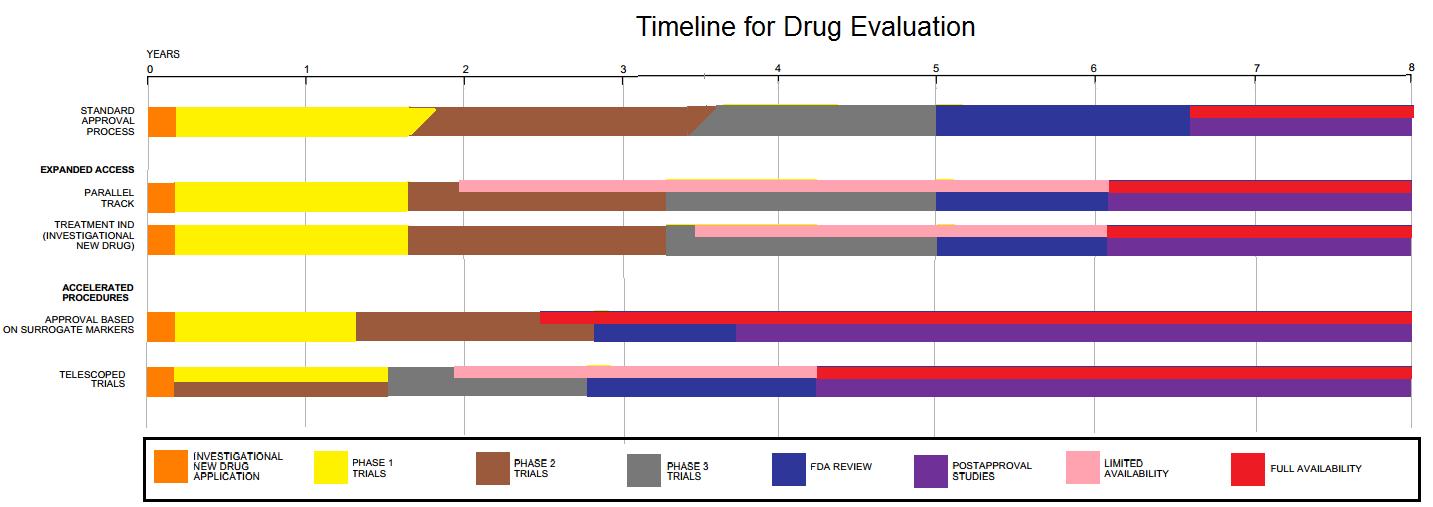
Investigational New Drug
Investigational IND includes:
Animal study data and toxicity (side effects that cause great harm) data
Manufacturing information
Clinical protocols (study plans) for studies to be conducted
Data from any prior human research
Information about the investigator
Permissions to transport drugs across state boundaries.
Drug Patent
Laboratory Data, Patient Data
Clinical Trials 21CFR312
| CLINICAL TRIALS PHASE OVERVIEW | ||
|---|---|---|
| Drugs | Medical Devices | |
| Phase 1 | Tested on Healthy Patients Maximum Tolerated Dose. Safety, Dose threshold, Biological Therapeutic Effect Sie of Population <100
|
|
| Phase 2 | Tested on Patients with the Condition Side Effects
|
|
| Phase 3 | Tested on General Population Volunteers 100-1000 Patients Comparing Placebo and Current Therapies to New Therapy |
Evidence
New Biomedical Devices
Therapeutic Biologic Application (BLA)
Approval
International Medical regulations
EDQM European Directorate for the Quality of Medicines and Healthcare
Storage and Handling of Chemicals
Maximum Allowable Quantities
International Fire Code
Ladder Supports and Clearances
Voltage Requirements and Related Ground Faulting
Laminar Flow Hood Qualification
Clean Room Qualification
FIRE MANAGEMENT SYSTEMS
Fire Management Consulting: Prevention, Planning, Rescue Operations, Hazard Identification, Communication Protocols, Adherence and Enforcement of Policy are all elements of Fire Management
Goals(General): Prevent Injury, Preventl loss of Life, Prevent loss of Property
Objective (Metrics): Prevent ocurrence of fire and explosion (#). Provide Means of Escape (t). Contain, Control and Suppress fire and explosion origins. Decrease total number of work related casualties (h). Decrease total number of loss work hours. Decrease total number of work related injuries. Increase the level of safety by introducing added meeasures of protection in each task performed.
Fire Prevention Plans must be kept in writing and must be communicated orally to all personnel.
Establish a Storage and Handling Zone. Isolate zone from heat sources at least 35ft away. Consider mass transfer of vapors. Consider also temperature effects that may volatilize liquids far away from a heat source.
Isolate the Handling Zone from electric conduction by grounding the casing.
In the Event of a fire Understand the Elements of the Fire Triangle and how to isolate the heat source from the oxidant, or how to lower the temperature of the fire.
Know Fire Chemistry: Stoichiometry, LEL, UEL, LFL, UFL, Heat of Combustion, Latent Heat, Heat of Vaporization, Conduction, Convetion, Radiation, Reid Vapor Pressure, Ignition energy, Ignition Temperature, Heat Value, BLEVE, Vapor Cloud Explosion, Overpressure, Backdraft, Flashover, Flash Point,
Causes of Explosions: Spark, Arc, Heat Conduction, Convection, Radiation, Deflagration, Collision, Friction, Nature, Chemical Reaction, Nuclear Reaction
Two Types of Explosion: Deflagration vs Detonation
Effect of Pressure and Temperature on the LEL and UEL. The Flash Point is the lowest temperature and pressure at which a vapor/liquid may spark or ignite.
Explosions are divided into two different categories. Deflagration and Detonations, both invove equilibrium procesess of a gas, an oxidizer, and heat in a medium undergoing expansion. Deflagrations occur with mass transfer at low velocites directed at the reaction zone wheras Detonations are violent and the expansive gas is the reactive zone.
Design Considerations: Spacing, Protocols, Procedures, Sewage Control, Diking, Housekeeping, Tool Inspections, Heat source elimination, area desinations, Training.
Fire and Electricity: Eliminate Arc, or Sparks by using rated currents far from the boundary limits for conduction or arcing of current. Ground, and Bond equipment, tanks, storage bins, Understand Charge dissipation, Capacitance, Resistivity, Induction
Understand Fixed and Portable Fire Protection Systems (OSHA29CFR1910.160): Extinguishing Agent, Nozzle, Piping, Control Pane, Alarm, Detector, Visual and Audible Warnings.. Semianual inspections, Desired extinguishing concentrations shall be dispensed under 30seconds.
Fire Extinguishers: Located every 75ftA/D fire, 50ftBfire, when close to a flammable liquid storage area. 1 Fire Extinshisher per 3000sqft of building area.
| Fire Extinguishing Materials | ||
|---|---|---|
| Substance | Supresses | Capacity |
| Water | A Fire | |
| CO2 | B/C Fires: Oil Fires Gas Fires Electrical Fires |
22, 9, 7, 5, 3kg. |
| FOAMs | ||
| Ammonium Phosphate | ABC Fires | 10, 5, 1kg |
| Halon | ABC Fires | low mass |
| Sodium Chloride | C Fires | dry powder only |
| Sodium Carbonate | C Fires | dry powder only |
| PPE Capacities | ||
| Fire Hose | 100gpm-1000gpm | |
| Fire Truck | ||
| Dry Chemical | Hydrostatic Test 6 years | |
Develop Cost Reduction Strategy
Develop Service Requirements:
Material Specifications for product, packaging, and labeling
Testing requirements
Budget
Quantities required
Shipping Timeframes
Vendor List: QA Screens Vendor List for Compliance issues from FDA, Recalls and Warning Letters. Operational Licenses, Certifications, Company Structure, Data Management and General Operational Qualit of the Vendor is Rated by QA.
Vendor Selection:
Involve a Cross Functional Team: R&D, Engineering, QA, Corporate. Material selection impacts directly product quality and company identity. All players should be involved in detecting vendor strengths and weaknesses.
Perform Facility Audit: Confirm strategic, logistic and productio infrastructure is present. Note any Structural issues that may affect product characteristics. Address long term manufacturing plan with site leaders to ensure no manufacturing changes will impact your supply.
Develop Quality Agreement:
Agree thatn changes in the manufacturing process or issues related to FDA inspections are reported and prevent their impact in your manufacturing process. Ensure that CAPAs, OOS, Customer Complaints are reported and addressed.
Monitor Qualification Status: Re-qualification process and on-site audit
PROCESS TRENDS:
CONTINUOUS IMPROVEMENT
FDA: http://www.accessdata.fda.gov/
Key words: Safety, Identity, Strength, Quality, Purity... Quality Control Unit...Batch Records Controls, Uniformity,Complaints, Surfaces not reactive, additive, absortive; Sanitization vs Sterilization; Justification of Deviations; Pyrogen, Containers, Second Person Verificatin, In-process testing; Bioburden, Time limitations, Reprocessing, 100% Visual/electronic Inspection. Tamper-Evident, Laboratory, Stability Testing, Release, Warehousing, Reserve Samples, Laboratory Animals, Records and Results. Are we now experts? Certainly not! Compliance is an ongoing Business, and Ongoing opportunity to correct everyday problems, new products require new solutions and as technology evolves, new facets require polishing by regulatory compliance. Quality is by Design!
The pointers are considered voluntary guidelines:
Definitions:
Multiple thermocouples throughout chamber (not inside product containers) to determine effect of load configuration on temperature distribution temperature distribution for all loads using all container sizes used in production should be tested –position of thermocouples should be documented Slowest to heat/cold spots in each run should be documented, inlcuding the drain –repeat runs should be performed to check variability temperature distribution profile for each chamber load configuration should be documented
Identification of Critical Factors and Operational Ranges. The performance of the sterilization process is linked to the maintenance and control of a set of defined critical factors:Parameters to evaluate as critical factors may include, but are not limited to:
LogD vs T: da Z. para un log10 reduction de D
D(150C)=20min
F(12D)= Kill time 12 fold reduction of known
ENGINEERING TRENDS: MICRO STERILIZATION VALIDATION <USP>71
ETO STERILIZATION
https://www.youtube.com/watch?v=AO0VDRWUmvY
Use on: Metals, Ceramics, Polymers, Thermodegradable or Thermosusceptible materials.
GAMMA RAY STERILIZATION (ISO 11137)
| SAL of 10^-6 | Probability of a viable micro-organism present on the device must be equal to or less than 1 in a million. One in a million (or less) devices are expected to remain contaminated after terminal sterilization. A sterility test on 10-100 samples isn’t even close to reliably measuring a failure rate of 1/1,000,000 devices. |
| CFU | Unit of Viable bacterial or fungall cells reproducing by Binary Fission |
| [kGy] | absorbed units / unit mass |
| D10 [kGy] | 1 log reduction on viable count. 90% reduction of total count. |
| Sample Item Portion | Proportion of Sample manipulable in a laboratory. |
| Sterility Test | http://www.nutekcorp.com/PDFs/white_why_web.pdf |
VDMAX-15 VDMAX-25 |
selected sterilization doses of 25 kGy and 15 kGy. The method for 25 kGy is applicable to products having an average bioburden less than or equal to 1,000 CFUs (colony forming units) per device. The method for 15 kGy is applicable to products having an average bioburden less than or equal to 1.5 CFUs per device. VDmax Method: Justification for a sterilising dose of 25 kGy or 15 kGy Bellow is an example of the procedure for the VDmax 25 method on multiple production batches 1- Obtain product samples The product samples must be representative of routinely sterilised products. 2- Determine the average microbial load of 3 batches of 10 pieces 3- According to the table of ISO11137-2, determine the verification dose 4- Conduct verification dose experiments; irradiate 10 products at the verification dose and perform a sterility test on each of the products 5- Interpret the results: Accept the 25 kGy sterilisation dose if 0 or 1 of the 10 pieces is positive. Conduct verification dose confirmation experiments if 2 are positive. Do not accept the verification if there are more than 2 positives 40 products are required for this method. This method is only viable for validating sterilising doses of 15 or 25 kGy. |
| Method 1 | 1- Select the sterility assurance level (SAL) and select 10 product samples from 3 independent production batches (or 30 samples) 2- Determine the average microbial load of the 3 batches of 10 items (method based on ISO 11737-1) 3- Obtain the verification dose (referring to table 5 of ISO11137-2) 4- Conduct verification dose experiments on 100 irradiated pieces (method based on ISO 11737- 2) 5- Interpret the results 6- Establish the sterilisation dose based on the results (maximum of 2 positives out of 100 pieces) 130 products are therefore required for this method. The advantage of this method is that it enables any sterilising dose to be validated. |
Method 2A Method 2B |
1- Select the sterility assurance level (SAL) and obtain samples of the product (at least 280 samples for 2 independent production batches) The product samples must be representative of the products routinely sterilised. 2- Conduct the incremental dose experiments; irradiate 20 pieces at incremental doses of 2 kGy beginning with the 2 kGy dose and using at least 9 values. This is to be done for each of the 3 batches involved. Perform a sterility test on each of the products. 3- Conduct verification dose experiments; irradiate 100 pieces at the verification dose and perform a sterility test on each of the products 4- Examine the results 5- Establish the sterilising dose based on the results |
Performance Qualification (PQ)
Product PQ: carried out under the supervision of the product manufacturer. This determines compliance of the sterilization process on the product.
1) Dose Mapping: The first step of the validation is to verify that every product in the sterilization container receives a dose complying with the specifications (for example 25-40 kGy). As the dose received by the products can depend of the density of the products and their position in the sterilization container, before performing the dose mapping validation, the product loaded patter shall be established. With this product loaded pattern, dosimeters will be placed to measure the dose received by the products at different points of the sterilization container.
2) Validation of the sterilising dose: This part of the product PQ makes it possible to validate the minimum irradiation dose required to sterilise the product (i.e. to guarantee a sterility assurance level (SAL) of 10-6). 3) Validation of the maximum dose: This part of the validation procedure verifies by means of various kinds of tests that product characteristics are not degraded by irradiation, even at the maximum dose.
 ____
____ 
PROCESS VS PRODUCT CONTROL:
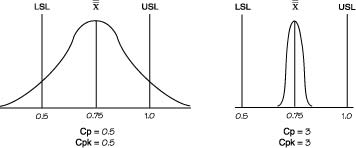
| Cp | (USL-LSL)/6σ (USL- Avg.)/3σ or (Avg. - LSL.)/3σ Engineering Tolerance / Natural Tolerance Processes in control are close to Cp = 2. This parameter tells you what is the "process spread" assuming that manufacturing is normal. Cp shows whether the distribution can potentially fit inside the specification A high Cp tells you that variation in output is low around process specification. Uses Subgroup Variation. |
||||||||||||||||||
| Cpk | Cpk = Min(CpU,CpL) Ability to produce outcome within specification Desribes how mean is centered within Specification. Shows whether the overall average is centrally located. Cpk =2 means your width can grow 2 times before going OOS Cpk can never exceed Cp. Cp can be seen as the potential Cpk if the overall average is centrally set. If Cp is 1.20 and Cpk is 0.69. This shows that the distribution can potentially fit within the specification. However, the overall average is currently off center. The Cpk value does not state whether the overall average is offset on the upper or lower side. Cpk=1.0), a process will produce approximately 99.73% good product or .27% bad product. At Cpk = 1.33.the process will manufacture approximately 99.9937% good product or .0063% bad product. |
||||||||||||||||||
| Pp | (USL-LSL)/6σ (Upper Spec - Lower Spec) / 6 sigma OR (USL- Avg.)/3σ or (Avg. - LSL.)/3σ Uses Overall Variation |
||||||||||||||||||
| Ppk: | Ppk = Min(PpU,PpL) Sshould be close to Cpk if process is stable and variation is small. Estimator of process control before process has been controlled, usually when process has output a low number of products Ppk is used to determine how "in control" a process is. |
||||||||||||||||||
| Accuracy | Accuracy = Xbar - X Residuals = Difference between observed and Estimated value |
||||||||||||||||||
| Precision |
|
||||||||||||||||||
| Nelson Rules | Special Variation Rules: Rule 1: 3std from mean Rule 2: 9 consecutive points above or below mean Rule 3: 6 or more points continually increasing or decreasing Rule 4: 14 or more points continually oscillating. Rule 5: 2 or more points are consecutively more than 2std from mean in same direction. Rule 6: 4 or more points are consecutively more than 1std from mean in same direction. Rule 7: 15 or more points are consecutively within 1std from mean. Rule 8: 8 points are out outside of 1 std deviation from mean in both directions. |
||||||||||||||||||
| Tolerance | Difference between the USL and LSL. | ||||||||||||||||||
| Confidence Interval | "We are 95% confident that our interval will contain the sample mean of the population... that is to say that we are 95 times out of a 100 finding the mean of the population within our confidence interval and 5 times out of a 100 we are not. 95% speaks about the process of finding the confidence interval and has Nothing to do with the mean of the population" |
||||||||||||||||||
| Power of Test | 1-Beta Increase: Required Sample Size, n; Detectable Difference, between the mean under H0 and H1, µ0 − µ1 ; Level of significance, α; • Decrease: Variability |
||||||||||||||||||
| Gauge R&R | Gauge R&R is a test of variance between the effect of The Part, The Operator and the System
Variation = Vpart + Vgauge(R&R) Crossed R&R: Xbar and R
resolution= Sigma/Mu
Nested R&R: 1op, similar.parts.(destructive) Gauge Run Chart by Operator Repeatable: Instrument COPQ: cost of poor quality. |
||||||||||||||||||
| Z score | Standardized value of how one score compares with Population in terms of Standard Deviations.A z-score equal to 1 represents an element that is 1 standard deviation greater than the mean. Z = (x - mu) / sigma 2/14/34/34/14/2 |
||||||||||||||||||
Hypothesis Testing Null Hypothesis |
Statement of rejection adopted to commence a statistical analysis. Null hypotheses are not inferred directly.The Null hypothesis is rejected by testing the validity of the opposite statement.
http://support.minitab.com/en-us/minitab/17/topic-library/basic-statistics-and-graphs/hypothesis-tests/basics/type-i-and-type-ii-error/ |
||||||||||||||||||
| P Value | Small p-value (typically ≤ 0.05) indicates STRONG evidence AGAINST the NULL hypothesis, so you reject the null hypothesis. Large p-value (> 0.05) indicates WEAK evidence AGAINST the NULL hypothesis, so you fail to reject the null hypothesis p-values very close to the cutoff (0.05) are considered to be marginal (could go either way). |
||||||||||||||||||
| Error Tipo 1 | False Positive: Incorrect Rejection of null hypothesis. The probability of making a type I error is α, which is the level of significance you set for your hypothesis test. An α of 0.05 indicates that you are willing to accept a 5% chance that you are wrong when you reject the null hypothesis. For a fixed sample size, the probability of making a Type II error is inversely related to the probability of making a Type I error. Thus, in order to achieve a desirable power for a fixed level of significance, the sample size will generally need to increase. EX.: Null: Two medications are the same. A type I error occurs if the researcher rejects the null hypothesis and concludes that the two medications are different when, in fact, they are not. |
||||||||||||||||||
| Error Tipo 2 | False Negative: Failure of rejection of False Null Hypothesis. The probability of making a type II error is β, which depends on the power of the test. You can decrease your risk of committing a type II error by ensuring your test has enough power. You can do this by ensuring your sample size is large enough to detect a practical difference when one truly exists. EX.:Null Two medications are the same. the researcher concludes that the medications are the same when, in fact, they are different |
||||||||||||||||||
| Isolating Special Causes | Pareto Charts Ishiawa Diagrams SIPOC: Supplier Input Process Output Customers |
||||||||||||||||||
| Kaizen | Group Effort driven towards Continuous Improvement Plan-Do-Check-Act
|
||||||||||||||||||
| T Test | Hypothesis test comparing the Mean of a Population vs a Reference Mean Student's T test: small population, deviates from Normal Distribution, gives a Probability Density Function. 1 sample T-Test compares mean of a population to the reference standard when the standard deviation of the population is unknown. 2-sample T-Test compares means of two populations. T Paired: Compares two ligated observations. Ex.: Before and After weight loss. |
||||||||||||||||||
| T value | Measures Difference in terms of Standard Deviations. The greater T value (+/-) the greater evidence against (to reject) Null Hypothesis | ||||||||||||||||||
| P value | Probabilty that the Two Sided T value is above and below the T value in a T distribution. When the Null hypothesis is true the T value falls in this probability region with. High P value = True Null. Low P value = Data does not contradict Null Hypothesis. P values are calculated on the assumption that the Null is true for the population and that the difference between populations is by random effects. |
||||||||||||||||||
| ANOVA | Analysis of Variance: Hypothesis test that allows the comparison of variation between groups. F-Statistic: Similar to T-Statistic from a T Test. |
||||||||||||||||||
| Normality Test | Skewness and Kurtosis should be close to 0 in a Normality Test. Shapiro Wilk Test with p < 0.05 |
||||||||||||||||||
| System Suitability | Test to ensure Systems, Analytes, Columns, Reagents and Operators are functioning properly prior to formal Analysis Execution. | ||||||||||||||||||
| Limit of Linearity | See Test Method Validation | ||||||||||||||||||
| Limit of Detection | See Test Method Validation | ||||||||||||||||||
| Attribute Charts |
NP-Chart: for monitoring the number of times a condition occurs, relative to a constant sample size, when each sample can either have this condition, or not have this condition P-Chart: for monitoring the percent of samples having the condition, relative to either a fixed or varying sample size, when each sample can either have this condition, or not have this condition c-Chart: for monitoring the number of times a condition occurs, relative to a constant sample size, when each sample can have more than one instance of the condition. u-Chart: for monitoring the percent of samples having the condition, relative to either a fixed or varying sample size, when each sample can have more than one instance of the condition. |
||||||||||||||||||
| DOX | Design of Experiments | ||||||||||||||||||
HVAC
HVAC BasicsAir Filters
HVAC Controls
Air Balance
Cleanroom Basics
LAB HVAC
Boilers: Boiler Video
CLEAN ROOM TESTING
[cGMP], Institute of Environmental Sciences Technologies [IEST], and International Organization for Standardization [ISO].
Airflow volume / velocity readings - assures that both unidirectional and non-unidirectional flow areas are properly balanced and unidirectional zones are maintaining proper air patterns
Room air exchange rates - states if the area is meeting its design airflow
HEPA filter integrity testing - tests HEPA filters and system for leaks
Non-viable particle counting - reports the amount of airborne particulate of a specified size in the clean zone
Temperature / relative humidity testing - examines whether the air HVAC controls are functioning properly and uniformly
Pressure cascade monitoring - verifies that room differential pressures are operating according to design
Optional tests include:
Air balancing - adjusts airflow in the air handling systems to achieve design airflow, room air exchange rates, and pressure cascade
Airflow visualization testing – qualitatively verifies airflow direction using a source of visible fog
Viable environmental monitoring [EM] - samples both the air and surface for microbe enumeration and identification
Compressed gas testing [compressed dry air (CDA) testing] – assures that the compressed gas sources meet the requirements of the controlled environment for contamination and microorganisms
Lighting, vibration, and sound tests – assures worker comfort
All other special tests from the ISO/IEST guidelines
SIX SIGMA: One Sigma, Two Sigma, Three Sigma, Four Sigma, Five Sigma, Six Sigma... yeah... we got there... is it that simple? SSSFFF currently at one sigma...Statistical Tools allow to predict future failures when past behavior is well understood. For this the variables affecting the process need to be well understood and well accounted. Enter Six Sigma...
ENGINEERING TRENDS: STATISTICS ANALYSIS: All statistical analysis rest on IMPLEMENTATION. All numbers are followed by Human Decision Factors HDF and are Masked by interpretaion of the Statistics. Clear understanding of what the statistic represents and THE LIMITS of the refered to Statistical Analysis will incide in the Decision Making Process DMK. So at the the end of the Analytical process what you need to know is that you have successfully completed a DFSSQBDSASSCARQEQAIQOQFATHTetc... the point is to guide events to ZWR0 error.Statistics are extremely powerful.
Computational power presents the ability of modelling and making very accurate predictions in a variety of PROCESS or SYSTEM model analysis. Although advanced Mathematical Skills allow interpretation it is through experience of MODEL ADJUSTMENT that Statistical Analysis tour-de-forces into a Continous Monitoring Program.
Implementation of Continuous Monitoring Programs are the result of Human and Technological capabilities. Humans place the sensors and interpret data, technology gathers data and accelerates computational calculations. In the End, the role of the Quality Officer / sea un engineer, biologist, statistician, technician, operator / su rol es de 1-Ajustar el proceso para prevenir errores continuos. 2-Predecir modos de fallas para evitar tiempo perdido 3-Desarrollar estrategias que maximizen el uso de recursos 4-Ganar un entendimiento completo del proceso y sus variables para destinar recursos.
Ya entendido esto y habiendo ganado un tren de conocimiento en estadistica aparecen los verdaderos retos de considerar las variables y tomar decisiones que consumiran tiempo y costo. Enter Design of Experiments DOX. Leaders in process inovation understand that the allocation of funds destined to the execution of tasks along with the managerial accumen of project leaders is the half fraction of the process improvement process gains equation. The flow of information from decision to execution may cascade through usually 3 to 5 levels (Cascade Decision Loss). In each step of the two way communication ladder data is Lost, Misinterpreted, mistakenly calculated, held back by professional jealousy, held back by impunctuality or even top level project rearrangements. It is in this crucial step that most companies loose their capital. Swift decision execution forecast are backlogged by every single employees ability to carry the execution of the plan without interference from outside influence to the project. Error prediction is an applied science highly valuable and continually reevaluated. The responsibility of managers in adequately interpreting data is also key in maintaining a forward vision of process improvement. Process analysis may get recirculated in the plan-do-check-check-plan cycle without swift determination of task execution. Understanding the 4th dimension is key in making accurate and timely Value Added solutions to improce Company Performance in the era of the information tsunami.
Reconsidering the role of a leader in today's dynamic business models: Who leads a project? the CEO, the Manager, the Team Lead, the leading Tech, the rookie? In some business models the True Leader is the Rookie. The novice is outside the box, has no prejudice, has not formed clans within the company, has not offended the next door cubicle, and is looking to make an impression within the organization. More importantly than imagery, is the actual execution of the task and its measurable impact in daily, monthly and quarterly business goals. In a group of 4 there is a high probability that someone is prioritizing outside of the main focus and seeking to politicize a process advancement by acting in the last second. This is the same as taking the baton from a relay team in the last meter to claim the goal. This strategery is extremely common in the workplace because the work load is compressed. In compressed work loads there is no tracking of what each employee is executing and how the employee is prioritizing tasks, less time there is to rearrange priorities, so each employee is 'free' to jump in the final phase of the project once someone else took it from 1st gear to fourth. Sometimes the manager is aware of the individual and group contributions and eliminates the need for employees to make claims in the meeting spaces. Competition is key but the goal of any company is to align employees with the Common Goal. Microscopic gaining works to foment competition within a division but it may halter progress by creating internal division.
What are some other instances where a manager needs to eye internal conflict?
| Normal Probability Plot: | Tests data for normality, skewness, abnormal distributions. See Histogram. |
| Histogram | Graphical Representation of numerical data, like. a Bar chart relating the frequency of numerical values. It helps to visualize the type of distribution of the population, wether it is normal or skewed. |
| Boxplot | Data is presented in Quartiles, Median, Maximum and Minimum values. |
| X-Bar, R-Chart, vs Individual | X-Bar charts the process mean through time. R-Chart charts the process range though time. Range = Xmax - Xmin Always look at R-Chart first. If R-Chart is Out of Control then the X-Bar chart is meaningless. R-Chart Trends: Repeated Values, OOS points.
|
| T-test | Whether mean differs significantly. Relates T values to P values. |
| Chi squared | Whether Categorical data from two data sets are related and if their differences are due to sampling methods or purely random effects. Chi square tests can only be used on actual numbers and not on percentages, proportions, means, etc. |
How is a Non Conformance generated? Again, a non conformance is Detected.
Is a Non Conformance a CAPA? What is a CAPA? No, NCs may trigger a CAPA but an NC in itself is the detection of deviation or error in expected product, packaging or delivery performance.
In the Industrial setting NCs are generated out of the high expentancy of delivering a high quality product. Any minor deviation in expected results is a Root Cause for an NC.
NCs are investigated under several possible root causes stemming from Machine Behavior, Environmental Triggers, or Human Behavior and as such root causes are established when the determining factors have been dully and fully investigated. Machine Behavior takes into account the Tolerance and the acceptable boundary performance of the unit under NC. When a machine breaches Upper or Lower boundaries of performace an NC is triggered. Yet it is possible by Statistical means to detect NCs prior to occurring, like predicting the future.
About Root Causes: Lets Establish Machine-Environment-Human as the three main Root causes. The cause-fault tree is then stemmed from Machine-Maintenance Schedule-Material Failure-Material Reaction-Unknown Material Reaction-Power Failure due to Machine action... then enter Environmental: Rain, Snow, Humidity, Lightning, Power Failure, and other unnatended keys to root an adverse action, then Human: Lack of Training, Lack of Attention, Excessive Overwork, Work Flow Interruptions, Social Interruptions, Error, or Slack. The classification of these Root Causes is set upon by Management in each Site. Managing these Root Causes is key in preventing future failures and understanding -in depth- the root cause is key in establishing the actions to prevent future occurrences. The balance of managing and correcting actions when humans are involved is a delicate subject because most of the times the Root Cause contains several main root causes in conjunction that lead to the NC event recorded.
Denial, Commitment, Ethos, Diligence, Leadership, Accountability, Stewardship, Role Description, Task Load, Past Performance, Training Record, even Personal and Familial issues are brought into the balance equation to determine the root cause of an event. Recall that Process Failures are costly, sometimes very very costly, all the while there are internal competition within organizations that lead to push and pull responsability for the NC. While it is natural for humans to fail, and failure is even expected, it is also natural to -chide blame-......who wants chastisement? who takes blame? who is ultimately responsible and who takes the blame? These are very delicate issues and are at the core of what make up any major company, organization or work structure. It is why here at SSSSFFFF we are interested in learning your perspective in these details. How does Culture, Polical Stability, Economy, and Technology interplay. What are the best models of management and do they work in the corners of Earth? How can micromanagement and laxity coexist? Are there tools to measure this amalgam of Human-Machine-Environment issues or is it fundamentally decided by gut feelings or by numerical calculations? The answer is always yes. Write to us at info@syntheticforest.net for your perspective.
What are equations governing Tank Loading, what are the thermodynamic ambience of the Tank, what are the clearance and dikes of the walls, are there Firefighting Measures to support a spill. Take the Tianjin Explosion: likely caused by either an Error in Loading, or an Error in Ventilation. The magnitude of tank explosions or BLEVES, Boiling Liquid Expanding Vapor Explosion can be witnessed in Tianjin or simply YouTube BLEVE... Tank safety is very important.
BLEVE 1: Train Car Explosion. Funny how the narrator at 1:10 claims a record was established for a tank blown by a bleve. Not funny that perhaps firefighters died in that explosion. It is why most Plant fires are either immediately contained or let to consume the matter it combusts. Decomposition gases in fires are extremely toxic, many material classes are combusted so fighting the fire becomes a difficult task of both accessing the source to prevent additional combustion and in the selection of fire retardant or fire extinguishing material to add to the flames.
BLEVE 2: The Tianjin Explosion.
Here at SSFF we take matters into accountability for Tank installations. Is your tank for Biotech? Pharma? Cosmetics or Food? Petroleum or Fuels? Gases? There are many considerations into tank work. Take a Fermentor for example. A Fermentor runs a biological reaction that once started it will see its product completed in 30 days. Any basic tank profile or design failure will affect the outcome each and every time, and it could take years to discover that a tank design feature was the root cause of a drop in yield in a site. Take a food tank, is it leaking, is the heat vest broken, are the transfer lines clean? Where good care meets good quality, excelent products emerge. Let us take good of your tank.
Each Tank is birthed through a process involving welders, engineers and inspectors. First select the right material supplier and review the material requested once on-site. Double check to ensure quality, chemical caracteristics, surface polish, electrodeposited finish, etc, is it 3XX? You need to know. The tank will sleep in a bed of rock, or will it need a safety layer underneath to prevent leakage. Was a geologist contacted to study the soil? A stable base is key in ensuring tank safety and longevity. Will your tank arrive prefabricated or will a civil engineer construct the wall. This is called Bunding and Ring Wall Construction. It takes into account natural disaster factors such as storm winds, tornado force shear, earthquake recurrence, and lightning strikes, even tsunami recurrence. So all weld points, joints, bolts and connections need to pass inspection before the next stages. Non destructive Ultrasonic or X Ray tests may be performed to ensure right connections. The roof is lifted and bolted, so now fill it up! Water quality test, corrosion prevention, and stirring measures should follow in place.
Next up Piping: What are the inlet and outlet pipings into a tank? Ball Valves, Needle Valves, Butterfly Valves, Diaphragm Valves, Gaskets, Seals, Metals, and Ratings. Where does the piping run from. Are there any intersections that flow into or out from the tank. What are the friction losses and how to account them. What is the tank insulation and Piping insulation. You need to understand blueprints to understand the flow into a complex installation. Usually tank are grouped in buldings called tank farms. Many pipes will flow into and out from the tank farm so it is of utmost importance to properly trace flow and to note any changes from blueprint to physical reality. A single change can mean a drop in quality or a loss of millions due to pressure losses or material product contact with a misplaced flow regulation unit.
Are there any environmental factors affecting the Tank use or is the tank heat cooled or coil warmed? All tanks have temperature operating ranges that ensure the quality of the materials inside. Here at SSSSFFFF we care about ensuring your tank's alarms are in place and that each valve works where it is intended and as intended. So tanks are a bit civil, mechanical, chemical and electrical.
Are you installing a Tank? Inspecting a Tank? Let us know. Our Engineers will Reach your Tanks to meet your cost and production requirements.
IEEE, Statics and Dynamics, down to computer language... How to separate URS from CSV?
CSVCSVCSVCSV
Circuits: Parallel, Series, Capacitors, AC-DC Rectifiers, Diodes, Switches, EMF, Lenz Law.
Batteries: Lead Batteries, Anodes, Cathodes, Electrodepositon.
Motors, ICCE, Crank to Cam, Alternators, Starting Voltage / Running Voltage = 6
Electrical Safety: Color Codes, Leather and Rubber Gloves, The neutral-ground-hot wire, electric shock safety, contact resistance . Welding. Wiring Installations. Here is a good link to understand home lighting installations.
Electric Motors, Alternators, rheostats potentiometer, variable resistances. Brushes, Commutators, Impellers, Harmonic Oscillators...
The electric motor works this way: First we have to ensure we are dealing with an Electric Motor and not an Electric Generator. An electric motor converts electrical energy into mechanical energy.
The electric generator works this way: Dynamos, Alternators take Power to Induce an electric Current. Rotor-Stator-Armature. Dynamos convert Power into Direct Current.. Alternators into Alternating Current.
Alternating Current: Lenz Law: when a coil cuts through magnetic field lines, that cut generates a current flow proportional to the angle it makes with the magnetic flow, with a max current flow at 0 degrees and 0 current at 90 degreens.
Direct Current: Commutator: Insulated Collar connected to a segment of the inducing coil. This produces pulsating half wave direct current.
See the video here.
Edison:Direct::Tesla:Alternating.
eieeeeeeeeeeeeeeeeeeeeeeeeeeeeeeeeeeeeeeeeeeeeeeeeeeeeeeeeeeeeeeeeeeeeeeeeeeeeeeeeeeeeeeeeeeeeeeeeeeeeeeeeeeeeeeeeeeeeeeeeeeeeeie
Transformers V2/V1=N2/N1, The primary coil, the secondary. Inductance.
Rectifiers: like diodes. AC to DC one directional transmitters.
Resistance, Impedance, Permittivity, Conduction and Radiative Flow.
Electrical Repairs and Inspections are performed only by qualified personnel
No electrical connections withing 50ft of flammable.
No Electric chord Interference with ladders.
Explosion Proof lighting.
Ground Fault Interrupter.
Proper circuit voltage and amperage.
Grounded Tools, Temporary Lighting, or Double Insulated Tools
A great weath of knowledge is needed to completely evaluate these systems.
Routine Monitoring and Evaluation is required to sustain acceptable concentration levels of substances in water.
Change Control documentation is warranted for planning and execution of process changes.
Refer to 40CFR, and 21CFR for the latest USA Federal Regulation Standards. Standards are included within the FDA, EPA, CWA, WHO and other standardizing bodies.
Welding Inspections and Certifications.
Bonding Metals, Metallic Transmutations
Nuclear Reactions
What tools do you need?
The history of machines.... Initially there were tools................(Boston Pops...).....
Many years have passed since humanity developed tools... takes a grasp and gasp at evolution..............
Complex Machines
Virtual Machines
Are you a Company that is selling a Machine? Get a spot here!
ENGINEERING TRENDS: MACHINES
Process Machines: Conveyors, Elevators, Mills, Cranes, Compressors, Precission Cutting,
..........................................................................................................................................................................................................
Simple Machines Complex Machines Virtual Machines:
Simple Machines are Archetypes of what Complex machines are made up off. Newtonian Mechanics govern the use of Simple Machines. Complex and Virtual Machines are out of the current scope.
Levers, Pulleys, Gears, Roller, Winch, Knife, Inclined Plane, what else?
Know your Lever: Effort Arm, Resitance Arm, Pivot. Types of Lever. Type 2 Levers MA>1, Type 3 Lever MA<1
Know your Gear: Gear Teeth, Gear Diameter
Winch: Compounded Roller
Knife and Inclined Plane: A knife is an inclined plane where the plane moves sliding the load over it. Does a knife cut an atom? NO! A knife cuts a macromolecular structure that is composed of atoms. Can you cut a macromolecular structure? yes.
Know a Pulley: Moveable Pulleys, Fixed Pulleys, Compounded Pulleys.
Mechanical Advantage = Effort/Load
UNDER CONSTRUCTION UNDER CONSTRUCTION UNDER CONSTRUCTION UNDER CONSTRUCTION UNDER CONSTRUCTION
NOITCURTSNOC REDNU NOITCURTSNOC REDNU NOITCURTSNOC REDNU NOITCURTSNOC REDNU NOITCURTSNOC REDNU
Let's build Something Together!!!
MODULAR HOMES
GREEN ENERGY HOMES
GREENHOUSE
ROADS
BUILDING A MODULAR HOME
Step 1 Plan your list of expenditures and draw a schematic model of the finished home. Be as descriptive as possible.
Total Square footage of SiteTotal Square footage of House
Total Number of Rooms: X
Step #2 Start The Build
Who do I call first? the engineer, the architect, the state permitting... Can I prefabricate the interior with finishes to shorten lead time?
Can I prefabricate plumbing or do I have to wait until the modules are completed?
Step #3 Routine Inspections and Correcting Errors
Step #Z Detecting Defects and Adressing their Correction
Step #ZZ Finishing. Terminaciones.
Modular Home Links:
1 acre = 43560sq-ft = 4047sq-m
GREENHOUSE
Preserves Radiative Heat by trapping absorbed heat.
Increases, and sustaing Temperature
Protects from Weather, Insects and Pests
Isolates growth from other Plants
Soil and Nutrient Standardization
Get TESTS:
Ultrasonic Testing
Infrared Camera
Air Velocity
Gas Composition
Ash Resistivity
Particle Size Distribution
Flow Regime
Temperature Mapping
Computational Flow Dynamics
Finite Element Analysis
Kaye Validator
HPLC
Gas Chromatography
TLC
Nuclear Magnetic Resonance
Mass Spectrometry
TEST METHOD VALIDATION: Experiments rating Test Method Performance. Test Method Validation involves editing and executing protocols (the METHOD) to test the adequacy of a given analytical procedure (the TEST), and by analytical we mean any activity that is measuring an observable wether qualitatively (categorical) or quantitavely. Test Method Validation answers the following questions:
Can the measurement system adequately discriminate between different parts?
Is the measurement system stable over time? Is the gauge response linear?
Is the measurement system accurate throughout the range of parts?
Does a gauge require Recalibration?
Is there any difference in measurement methods, or operators measuring the same part?
| Test Method Table | |
|---|---|
Accuracy |
Closeness between the average of one or more test results and an accepted reference value. Involves selecting a Standard or Reference point if none is available. ICH: minimum of 9 determinations over a minimum of 3 concentration levels covering the specified range (for example, three concentrations with three replicates each). Accuracy should be reported as percent recovery by the assay of known added amount of analyte in the sample or as the difference between the mean and the accepted true value, together with the confidence intervals. |
| Precision | the closeness of agreement among test results obtained under prescribed conditions. |
| Repeatability | Operator. The ability of an operator to consistently repeat the same measurement of the same part, using the same gage, under the same conditions. Closeness of the agreement between the results of successive measurements of the same part, carried out under the same conditions of measuremen (same operator) The ICH requires repeatability to be tested from at least 6 replications measured at 100% of the test target concentration or from at least 9 replications covering the complete specified range. For example, the results can be obtained at three concentrations with three injections at each concentration (3x3) |
| Reproducibility | Gauge. The ability of a gauge to consistently repeat the same measurement of the same part, using the same gage, under the same condition. Closeness of the agreement between the results of measurements of the same part carried out by different operators. Also called Ruggedness. |
| Linearity | Indicates that gage response increases in equal increments to equal increments of stimulus Beers Law A=eABC Evaluated graphically, in addition to or as an alternative to mathematical evaluation. The evaluation is made by visually inspecting a plot of signal height or peak area as a function of analyte concentration +-5% of expected response is considered linear. |
| Range | The values within which a measuring instrument is capable of measuring or which a generating instrument is capable of generating. ICH defines the range of an analytical procedure as the interval from the upper to the lower concentration (amounts) of analyte in the sample (including these concentrations) for which it has been demonstrated that the analytical procedure has a suitable level of precision, accuracy and linearity ICH requires the minimum specified range to be 80 to 120 percent of the test concentration on Assay Tests. |
| Uncertainty | Interval around a group of measurement on which a certain measurement will fall. |
| Bias | Systematic selection resulting in a measureable difference between the reference value and the expected value. |
Limit of Blank LOB |
LoB is the highest apparent analyte concentration expected to be found when replicates of a blank sample containing no analyte are tested. LoB = meanblank + 1.645(SDblank) http://www.ncbi.nlm.nih.gov/pmc/articles/PMC2556583/ |
| Limit of Detection LOD | LoD is the lowest analyte concentration likely to be reliably distinguished from the LoB and at which detection is feasible. LoD is determined by utilising both the measured LoB and test replicates of a sample known to contain a low concentration of analyte. LoD = LoB + 1.645(SD low concentration sample) The lowest quantity of a substance that can be distinguished from the absence of that substance (a blank value) within a stated confidence limit (generally 1%). Lowest detectable quantity but not necessarily proportionally quantifiable. Expressed in terms of Noise level S/N = 2-3 |
| Limit of Quantitation LOQ | ICH defines the limit of quantitation (LOQ) of an individual analytical procedure as the lowest amount of analyte in a sample which can be quantitatively determined with suitable precision and accuracy. Quantitation limit is the lowest concentration of analyte in a sample that can be determined with acceptable precision and accuracy under the stated experimental conditions. LoQ is the lowest concentration at which the analyte can not only be reliably detected but at which some predefined goals for bias and imprecision are met. The LoQ may be equivalent to the LoD or it could be at a much higher concentration. Expressed in terms of Noise level S/N = 10-20 Expressed in terms of RSD% |
| Recovery Data | Data is run in 80, 100, and 120% of label claim are run in duplicates or triplicates to serve as backup. |
| Specificity/Selectivity | Difference in Multiple Injections of a Homogeneous Sample. Presented as RSD = std deviation / mean Indicates Precision (Repeatability). |
| System Suitability | Instruments, Reagents, Columns and Analysts are working properly. Instrument Qualification-Method Validation-System Suitability: set of internal controls to ensure the unit performs as intended. |
| Method Validation | After qualifying a measuring unit a method to operate the unit is written. Method Validation is Instrument Specific and should demonstrate that under the method the machine is able to reproduce results as expected for standard values. During Method Validation the Acceptance criteria for the method is defined. |
| Tailing | |
| Sampling Plan | |
| Reference Standards | Internal Standard: Sample with known purity and no interaction with the analyte is inserted into sample. Quantitation is measured as the ratio of detection of one peak to another. |
| Acceptability Criteria | |
| Stability Testing | Estimates the allowed time span between sample collection and sample analysis. It is also important to evaluate an analytical method’s ability to measure drug products in the presence of its degradation products. Stability is tested by comparing the instrument response with that of freshly prepared solutions. System stability is determined by replicate analysis of the sample solution and calculation of the RSD of the responses. System stability is considered appropriate when the RSD does not exceed more than 20% of the corresponding value of the short term system precision. |
| References |
Reference 2 Validation of Chromatographic Methods Reference 3 Viscometer Calibration Presentation Reference 4 Labcompliance website |
| UNDER | UNDER |
| CONSTRUCTION | CONSTRUCTION |
Validation is needed to make sure a developed procedure fulfill the purpose for which it was designed for. Full validation is needed for New Methods or when major changes to an existing method affect the scope.
Partial validation is performed on previously validated methods that have undergone minor modifications. Generally, fewer tests are needed and are based on the potential effects of the modifications.
Cross-validation can be used as a means of assessing inter-laboratory execution of the same method.
Instrument Qualification-Method Validation-System Suitability: set of internal controls to ensure the unit performs as intended.
Please read the Center for Drug Evaluation Research guidelines for Chromatographic Validations, published by the FDA.
AUTOCLAVE METHOD VALIDATION
See Cleaning Validation (above)
FACTORIAL: 2^3: 3 factors. 2 levels.
CI: In each of the above, the following applies: If the true value of the parameter lies outside the 90% confidence interval once it has been calculated, then an event has occurred which had a probability of 10% (or less) of happening by chance.
DRUG DESIGN
TARGET SELECTION
DRUG FORMULATION
Injectables
Emulsions: Micro Emulstions, Trojan Horses, Micelles.
Liquids
Powders
Tablets
Capsules
API Synthesis and Storage
Techniques, Soxhlet Extraction, Sonication, Pelleting, Granulation, Mixing
Sonication: Match Tip size of sonicator with sample volume size; select narrow vessels to direct energy into solution. Amplitude and Intensity are directly proportional. Vary Amplitude to prevent foaming.
| USEFUL PROPERTIES | |
| STP Volume | 22.4 m2kmol-1 |
| Earth Escape Velocity | 1.1 (104)m/s |
| Gravitational Constant | 6.66 (10-11Nm2kg-2) |
| Electron Charge | -1.6 (10-19)C |
| Bar | 0.9869atm |
| Btu | 1055J |
| Btu/hr | 0.293W |
| 1kWh | 3413 Btu |
| N | 0.22lbf |
| W | 1.341(10-3)hp |
| 1lbm | 0.45kg |
| R | F+460 |
| K | C+273 |
| ∫cos (104)xdx | ∫cos (104)xdx |
| sec(θ) | cos(θ)-1 |
| Polar Form | z = a + ib z = re-iθ |
| z | r (cos(θ) + i sin(θ)) |
| a · b | |a| × |b| (cos(θ) |
| a · b | b · a |
Total P(A+B) |
P(A) + P(B) - P(A,B)
|
Joint P(A,B) |
P(A) P(B/A) P(B)P(A/B) |
| T distribution | t = x/r |
| Confidence Interval | |
| Confidence Limit | |
| Hypothesis Testing | |
| Probability Distribution | OR events And events |
| Binomial Distribution | |
| Combination | In how many ways can F1 pilots arrive 1-2-3. How many ways can specific F1 pilots arrive 1-2-3? How many combinations of A items and B items can result? |
| Permutation | |
| Moment of Inertia | |
| Vector Fields | |
| Centroid | |
| Truss, Pulley, Cables, Beams | Sections, Joints, Parallel axis theorem, Deflection |
| Resolution,Resultant, Couples, Systems, Equilibrium, Concurrent Forces, Reactions | |
| Homogeneus Constant Differential Equations | |
| Linear Nonhomogeneous Differential Equations Constant Coefficient | |
Fourier Series |
|
| LaPlace Transform | |
| Euler Approximation | |
| UNDER CONSTRUCTION | UNDER CONSTRUCTION |
| UNDER CONSTRUCTION | UNDER CONSTRUCTION |
| UNDER CONSTRUCTION | UNDER CONSTRUCTION |
The Engineering World
Under Construction